Introducing: Qeryz Analytics

It’s actually been quite a while that we’ve shipped out Qeryz Analytics. However, you may be wondering what exactly the numbers are and how you could utilize them – so I went ahead and wrote this post for all you clueless shmucks out there.
Before I start, I want to clarify the settings of the actual survey data I’m using for this post.
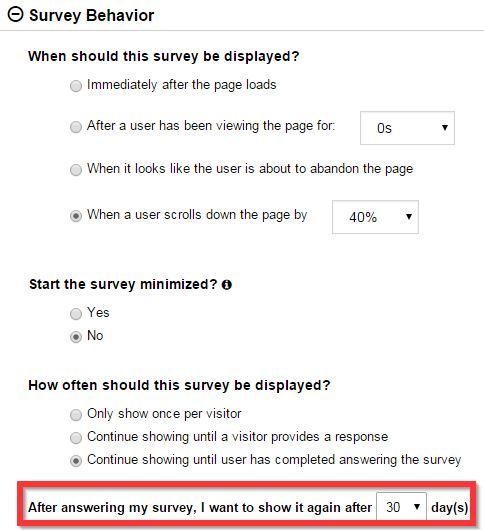
The survey I’m running is a site-wide survey. Meaning, the same survey runs on each and every page of my site. I set the survey to run with these settings:
For targeting: Basically everyone.

For behavior: People who scrolled down any page in my site by at least 40%. The survey will show to people even if they left or browsed another page in my site until they complete the survey 100%. The moment they complete the survey, it won’t show again until 30 days have passed.
Got it? Good. Let’s move on.
Your Daily Average
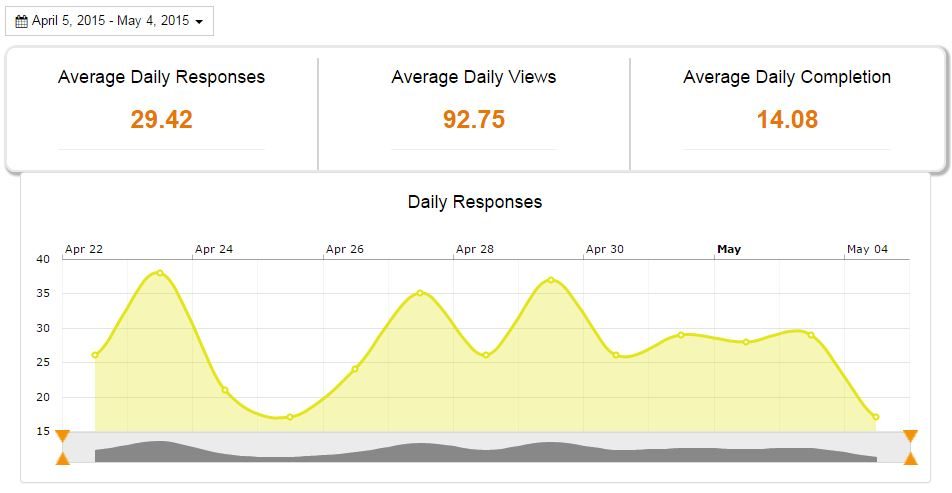
First off, the average bar. Everything average about your Qeryz survey is here – Average Daily Responses, Average Daily Views and Average Daily Completion.
Why is this important?
Because it shows you how your survey is performing – on average :)
Seriously, we want to have the best performing survey we could muster up. The response rate may be improved through a lot of things – check out our case study on how changing the Call-to-Action (CTA) improved our response rate by 2600%.
Without the average bar, you just wouldn’t know if what your doing has any significant positive impact to your survey’s overall response rate.
The Conversion Funnel
Why is this important?
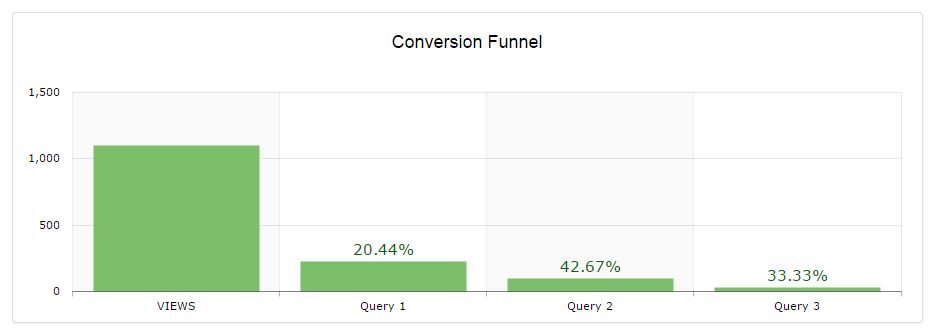
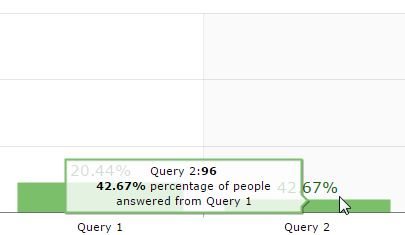
There’s not a lot of people running multi-part surveys but for those who do, this is a huge overview of how parts of the survey is doing. The screenshot above shows a 3-part survey with the first Query’s response rate being 20.44% from the views.
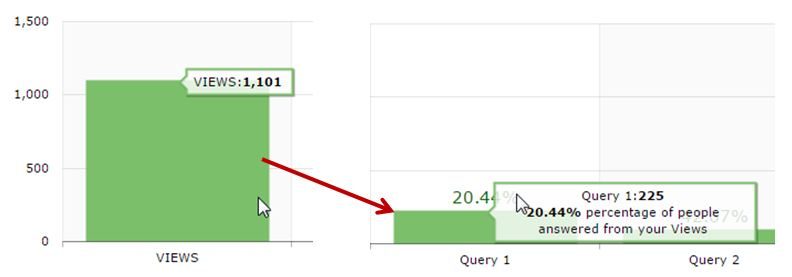 Basically it shows you how well your survey is converting in a views vs responses ratio. If you have more than 1 Query in your survey, its response rate will be compared to the previous query.
 This is for you to know how well your multi-part survey is performing.
The Overview
Why is this important?
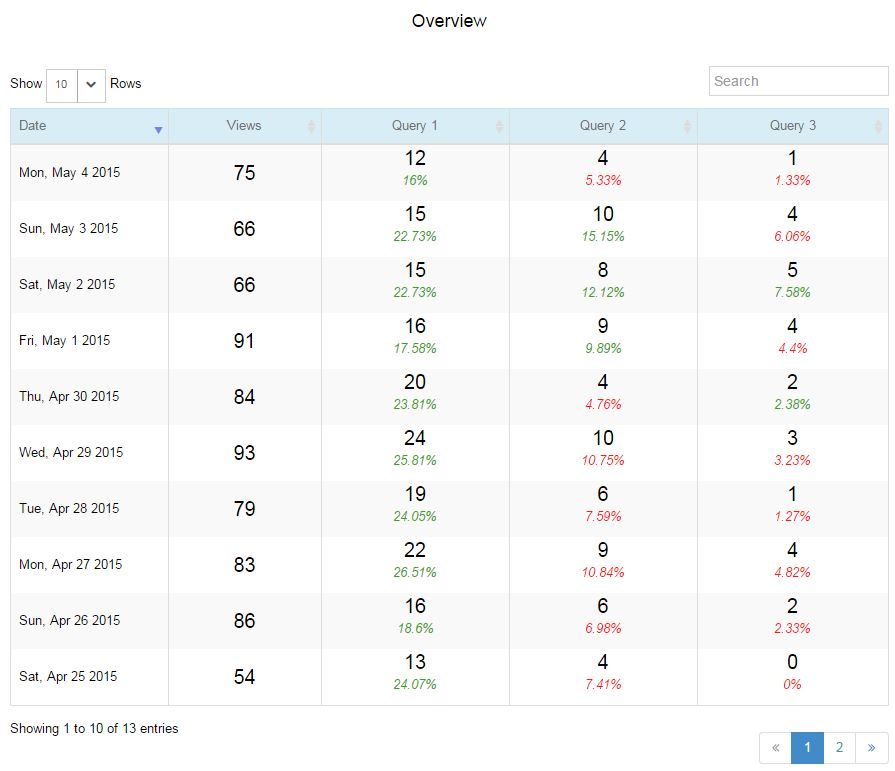
It’s basically a drill-down of your survey on a daily basis. For this example, I’m using a multi-part survey.
If I did anything special on the days that this data set was recorded, it will be able to pinpoint any fluctuation on my response rate. In the screenshot above, I didn’t do anything extraordinary so the data looks pretty stable.
If you’re running an experiment in your website or publishing a post in your blog, keeping an eye on your overview funnel can help you identify what you’re doing right in improving your response rate.
OS/Browser
It’s pretty straightforward – this is where you’ll see on what operating system and web browser most of your responses are coming from.
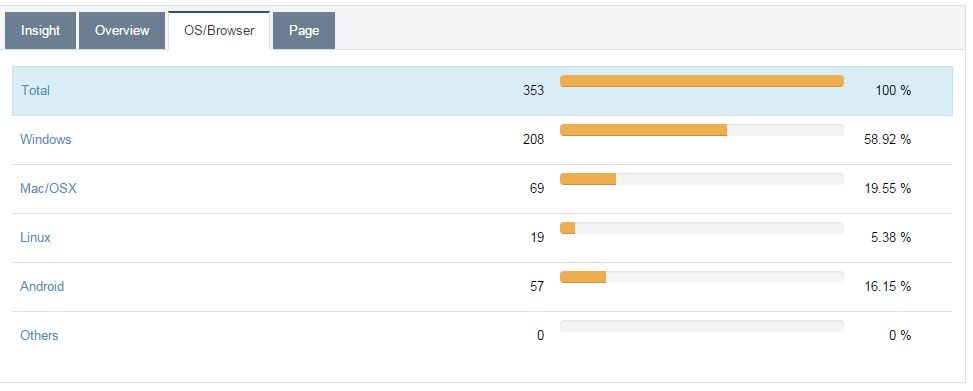 Clicking on any of the Operating Systems outlined there will drill it down to which web browsers your responders are using.
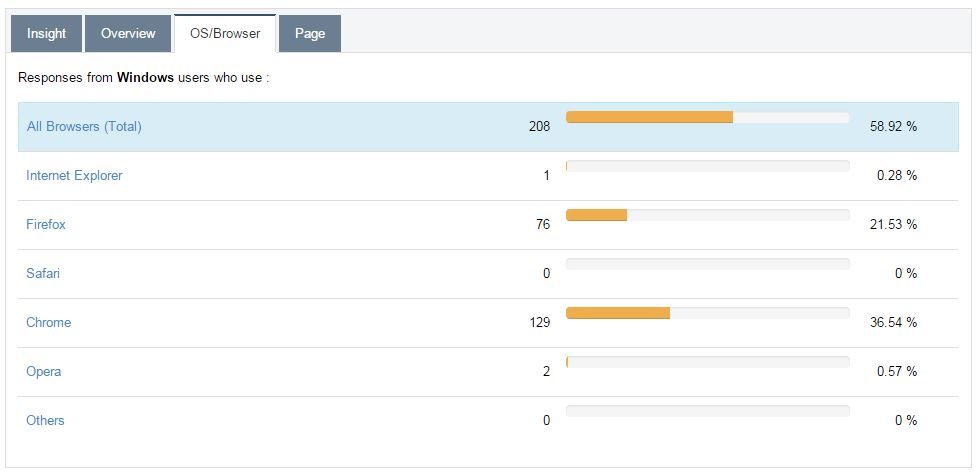
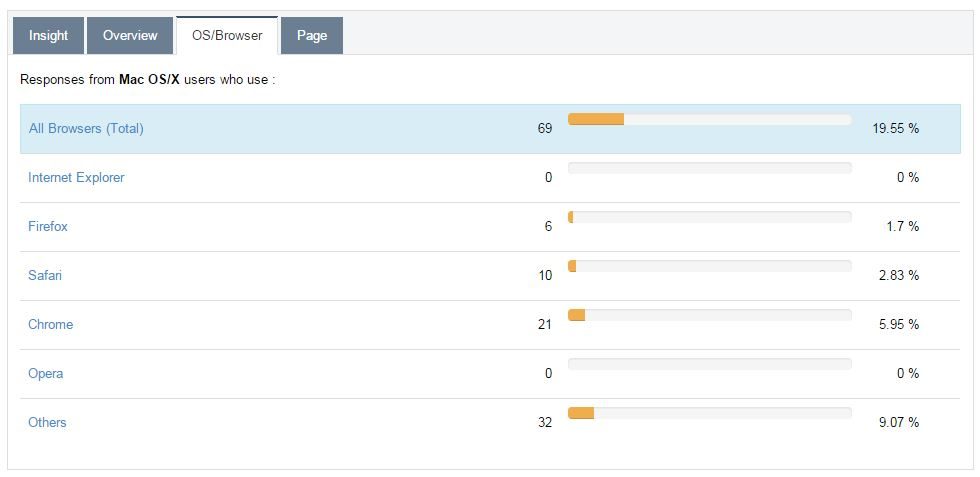
Further clicking on a specific web browser will enable you to see the segmented responses of users.
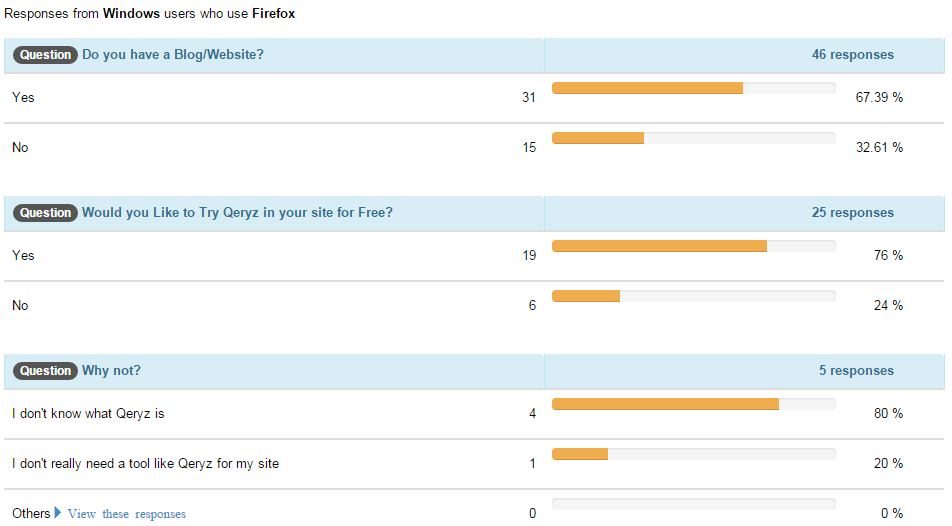
This is useful if you’re trying to extract feedback about your website’s usability. Sometimes there are front-end coding structures that don’t work on specific browsers. Your users may tell you something’s broken in your design but not tell you which browser they’re using to view it. That’s a problem.
This is the solution.
Page Analytics
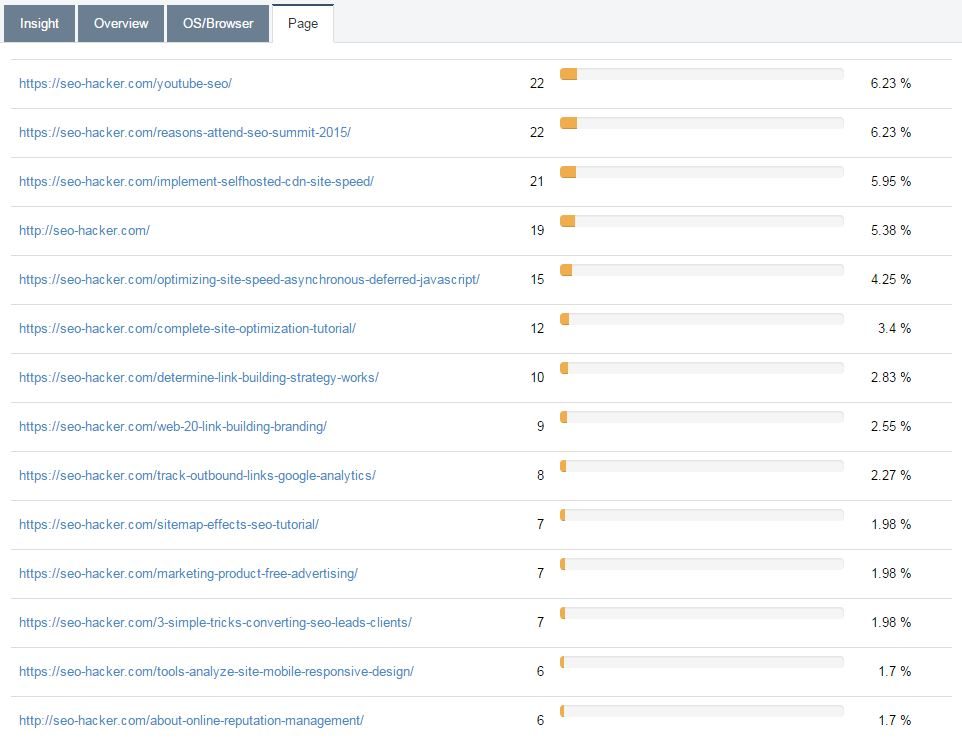
Why is this important?
There are just some pages in your site that encourages a user to respond more. In the screenshot above, you’ll notice that people are actually responding more in specific pages of my SEO Hacker blog than the homepage itself.
Meaning I could study elements in those pages and realize what is making people respond more in those pages than other pages in my site – and optimize them.
Your Turn
I don’t know about you, but I’m pretty obsessed with data and stats. That’s one huge reason why we built Qeryz Analytics. I hope that it proves to be a powerful tool in helping you optimize and track how well your surveys are performing.
The good news? Qeryz Analytics is unlocked for all account levels. We’ll be building exclusive features for higher-tier accounts soon.
Login your Qeryz account and give it a look!